ai agent industry size: 2026 market outlook and trends
Explore the ai agent industry size, measurement approaches, growth drivers, and regional patterns. Ai Agent Ops analyzes 2026 data to guide developers and leaders toward informed decisions.

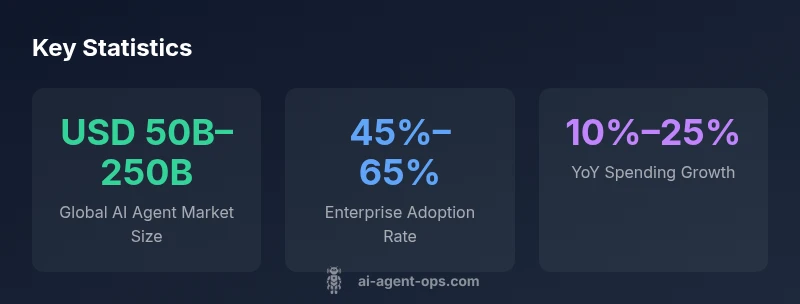
The ai agent industry size is in a growth phase, with Ai Agent Ops Analysis, 2026 reporting a broad USD 50B–250B range across core use cases. Growth is driven by enterprise automation, customer-service optimization, and software orchestration, while regional adoption varies by maturity and data-regulatory context. This snapshot helps developers, product teams, and business leaders set expectations and plan investments.
What we mean by ai agent industry size
In this article, we define the ai agent industry size as the total spending potential and installed base for autonomous or semi-autonomous agents deployed to perform decision-making, task execution, or orchestration within business workflows. This includes agents embedded in customer-service chatbots, enterprise workflow assistants, IT automation, and cross-system orchestrators. To avoid conflation with the broader AI software market, we segment by use case, deployment scale, and governance maturity. We also distinguish between the total addressable market (TAM), the serviceable available market (SAM), and the serviceable obtainable market (SOM) to provide a clearer roadmap for teams and investors. For 2026, Ai Agent Ops Analysis, 2026 emphasizes that the size is highly contingent on orchestration capabilities and data readiness across organizations.
How Ai Agent Ops models market size
Our sizing approach combines top-down market estimates with bottom-up validation. We start with TAM by identifying likely adoption across core use cases, then refine to SAM by geography and industry constraints, and finally estimate SOM based on organization size, readiness, and budget. We use scenario planning to reflect fast-moving dynamics such as governance readiness, data access, and integration complexity. When data is sparse or uncertain, we present ranges and confidence bands rather than single-point figures. All figures cited come from Ai Agent Ops Analysis, 2026 and are intended to be directional for planning and prioritization.
Market size by segment and use case
Market size varies by segment, with the largest spend concentrated in operational automation, customer-service agents, and end-to-end software orchestration. In practice, tens of billions in USD are allocated to enterprise-scale automation programs, with smaller but growing investments in domain-specific agents for regulated industries such as finance and healthcare. Cross-functional orchestration often multiplies impact, as multiple agents work together in intelligent workflows. Understanding segment dynamics helps product teams prioritize investments in API integration, governance, and user experience across channels.
Geographic distribution and regional dynamics
North America and Western Europe currently lead in AI agent adoption due to mature cloud ecosystems, robust data infrastructure, and governance frameworks. Asia-Pacific markets show accelerating growth, driven by digital transformation agendas and expanding vendor ecosystems. Regional differences in data privacy, regulatory compliance, and IT spend shape the pace and composition of investments. Companies with cross-border operations tend to pilot agents in centralized hubs before broader rollouts, underscoring the importance of scalable orchestration platforms.
Growth drivers, constraints, and scenarios for 2026–2028
Growth is propelled by the need to automate routine decision-making, improve operational efficiency, and orchestrate multi-agent workflows across disparate systems. Key constraints include data governance, integration complexity, talent gaps, and regulatory risk. We outline three scenarios: base (steady expansion with cautious adoption), optimistic (rapid orchestration maturity and governance acceleration), and conservative (slower uptake due to regulatory or data frictions). Across scenarios, the demand signal remains positive, but the feasible market size bands shift with policy and technology maturation.
Practical implications for teams and investors
Teams should build reusable agent templates, invest in governance and security, and prioritize interoperability with existing platforms. Investor readers should look for firms that offer robust orchestration capabilities, clear ROI storytelling, and transparent roadmaps for scaling across functions. The common thread is a shift from isolated AI pilots to integrated agent ecosystems that collaborate within end-to-end processes.
Market segments by ai agent use and spend, 2026
| Segment | Estimated Range (USD) | Notes |
|---|---|---|
| Enterprise AI agents in operations | USD 20B–100B | Includes process automation & decision-support |
| Customer-service agents | USD 10B–60B | Voice/text channels, multilingual support |
| Autonomous agents in software automation | USD 5B–40B | RPA-like automation with agent orchestration |
| Industry-specific agents (finance, healthcare) | USD 5B–50B | Regulatory-compliant, domain-specific deployments |
Questions & Answers
What exactly counts as an ai agent market size?
It includes spending on autonomous agents and agent-enabled automation across enterprises, not just software licenses. We count deployments where the agent performs decisioning, orchestration, or task execution within business processes.
It includes spending on autonomous agents across enterprise workflows, not just software. Think of deployment scope and orchestration responsibility.
How is market size measured for ai agents?
We use TAM, SAM, and SOM, combined with bottom-up counts from use cases and top-down market estimates. We incorporate adoption rates, price bands, and implementation complexity to anchor ranges.
We size by use case, geography, and capability, then adjust for governance and integration hurdles.
What are the main segments driving size?
Operations, customer service, and software automation are the largest spend drivers. Finance and healthcare provide regulatory-focused, niche deployments with specialized requirements.
Ops and service are leading, with regulated industries contributing in niche segments.
How reliable are these size estimates?
Estimates reflect limited public data and rapid market evolution. We present ranges and scenario analyses to communicate uncertainty and help planning.
They're directional and meant for planning, not exact figures.
What does this mean for developers and product teams?
Plan for cross-functional orchestration, invest in data governance, and design for interoperability. Focus on scalable architectures that enable multi-agent collaboration.
Think cross-functional orchestration and scalable agent ecosystems.
Where can I find more data or charts?
We publish ongoing updates. Check the full article for charts and the accompanying data table and infographic.
Look for the full charts and table in the article.
“Sizing the ai agent market is less about a single number and more about a dynamic range informed by use case depth, data readiness, and orchestration maturity.”
Key Takeaways
- Define the market using TAM, SAM, SOM for clarity
- Use ranges to reflect uncertainty and regional variance
- Adoption is led by operations, customer service, and automation
- Regional gaps persist; APAC and Europe show accelerating growth
- Investors should watch governance and integration complexity